The crash wave, and the quieter day after
A ten-day view of crash status among attempts in an internal task-run ledger, with the counts behind each share.
Data story · UTC daily cohorts
Crash status by UTC start day
Loading daily aggregates…
Source: aggregate-only internal task-run ledger snapshot. UTC start-day cohorts, not service availability. Download JSON · Animated preview (GIF) · Run the notebook (.py) with uvx marimo run --sandbox notebook.py.
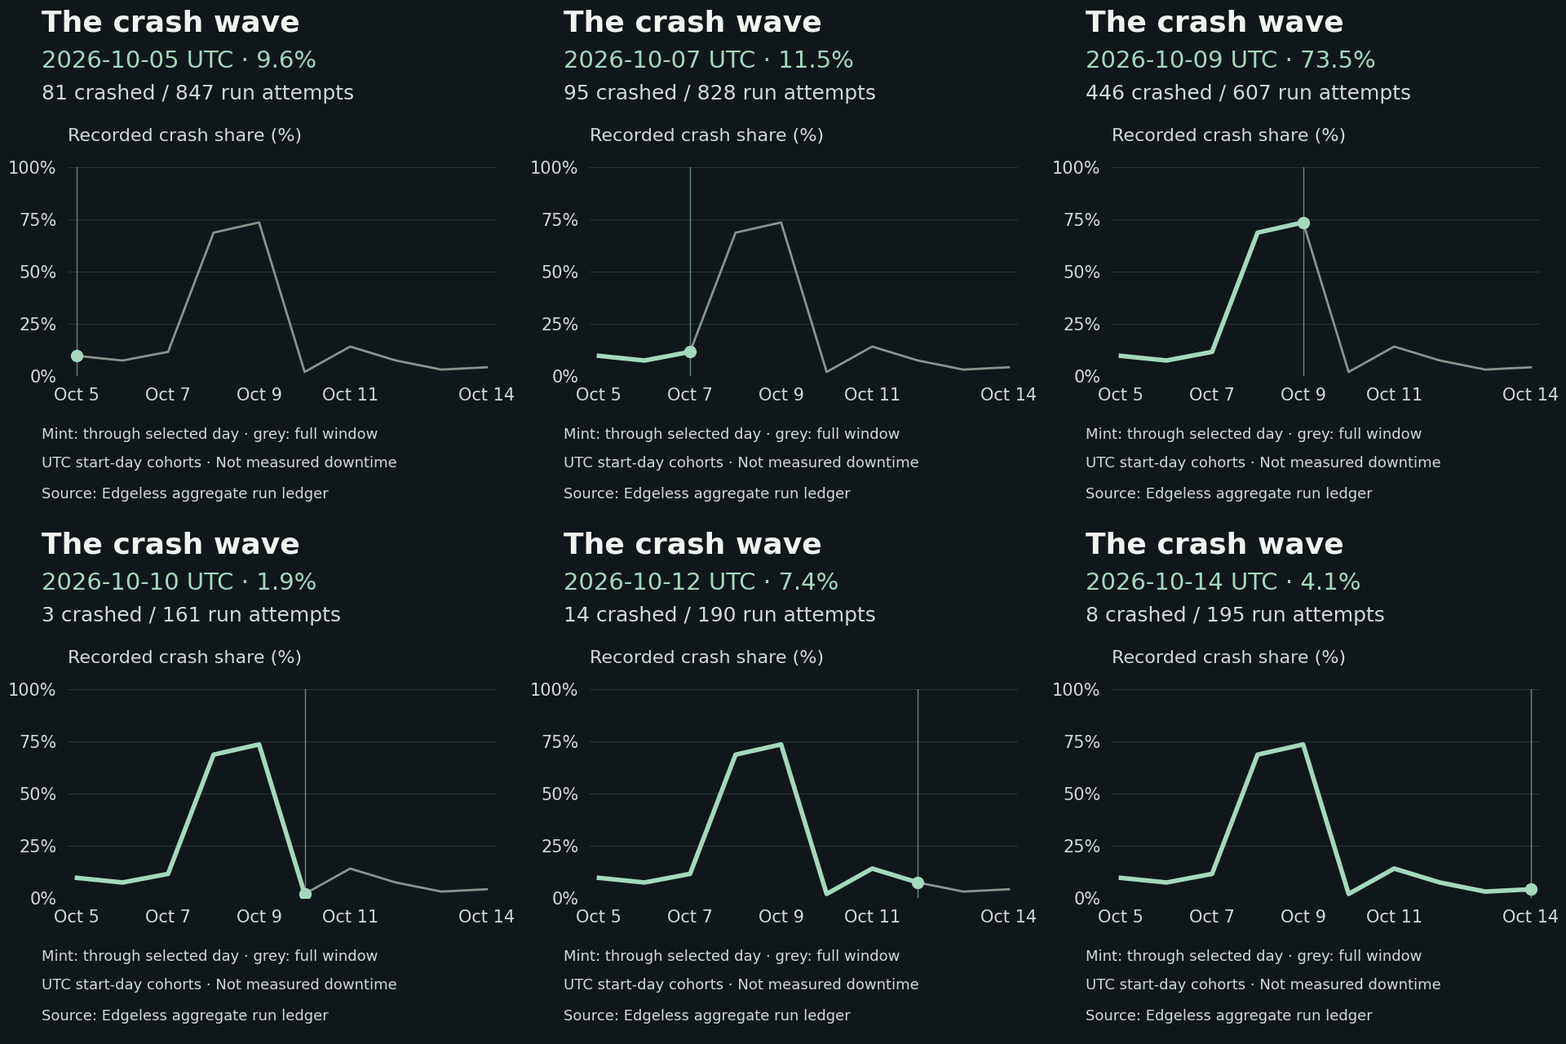

The recorded crash share rose sharply for attempts started on October 8 and 9, then fell on October 10. The counts matter: 657 of 958 attempts had crash status on October 8, 446 of 607 on October 9, and 3 of 161 on October 10.
These are status counts from a snapshot, not a timeline of service availability or evidence of a particular cause or fix. Scrub the chart to see each day's numerator and denominator.