Code as a Field of Relation
Thirty years of a single practice, stored as a graph instead of a list. LIA's software art, read through the relations rather than the dates.
Hover to trace. Tab to a node and press Enter to read its relations. Every edge below is drawn from the graph source, not hand-drawn.
Keyboard: Tab to a node, Enter or Space to select it. Screen readers: the summary line is announced; the relation rows are not individually announced. Not yet tested with VoiceOver or NVDA.
no node selected
Why a graph, and not a page
LIA's work resists a chronological list because the interesting thing is not what came after what. TURUX.at (1997) matters because it is interactive art built in code at a moment when the browser was barely a medium. Sum05 matters because it is a rule system that directs autonomous agents. Little Boxes matters because it takes the suburban grid and runs it through that system. Stated as a list those are three facts. Stated as a graph they are one argument.
So this note is backed by a graph, written in N4L — the language of SSTorytime — compiled and loaded into a real Postgres instance. The page you are reading queries the same structure that is stored in the database.
What is actually stored
SSTorytime has no link table. Edges live as fixed-width arrays on each node row, and the four arrow types below are the entire vocabulary. That constraint is the point: with a handful of arrows you cannot encode a hundred vague relationships, so every edge has to earn its place.
| Arrow | Reads as | Used for |
|---|---|---|
| (cr) | creates | authorship and production |
| (ex) | is an example of | class membership |
| (year) | happened in years | time |
| (source) | has source | provenance, every node |
| (about) | is about | topic and medium |
| (note) | note / remark | the claim itself |
Reading the graph
LIA is a person, and in a graph like this a person is a hub risk — every
edge ends up pointing at them and the structure becomes a star that tells
you nothing. The fix is to make the works the load-bearing nodes
and let the practice be a context rather than a centre. That is why
LIA carries the year range and the medium, while the works
carry their own lineage.
The drawing opens in structure only: five nodes that
declare something, wired by creates and
is an example of. The other sixteen nodes are values — a town,
a date, a remark, a URL — not subjects. Select every edge to bring
the property edges back, and they come back dashed, because a remark is not
a relation.
The result is a small graph in which you can ask a question a list
cannot answer: follow creates out of any node and you are
walking the actual body of work; follow is an example of and you
are walking the medium.
The source
This is the complete graph. It is short on purpose.
Evidence from the running database
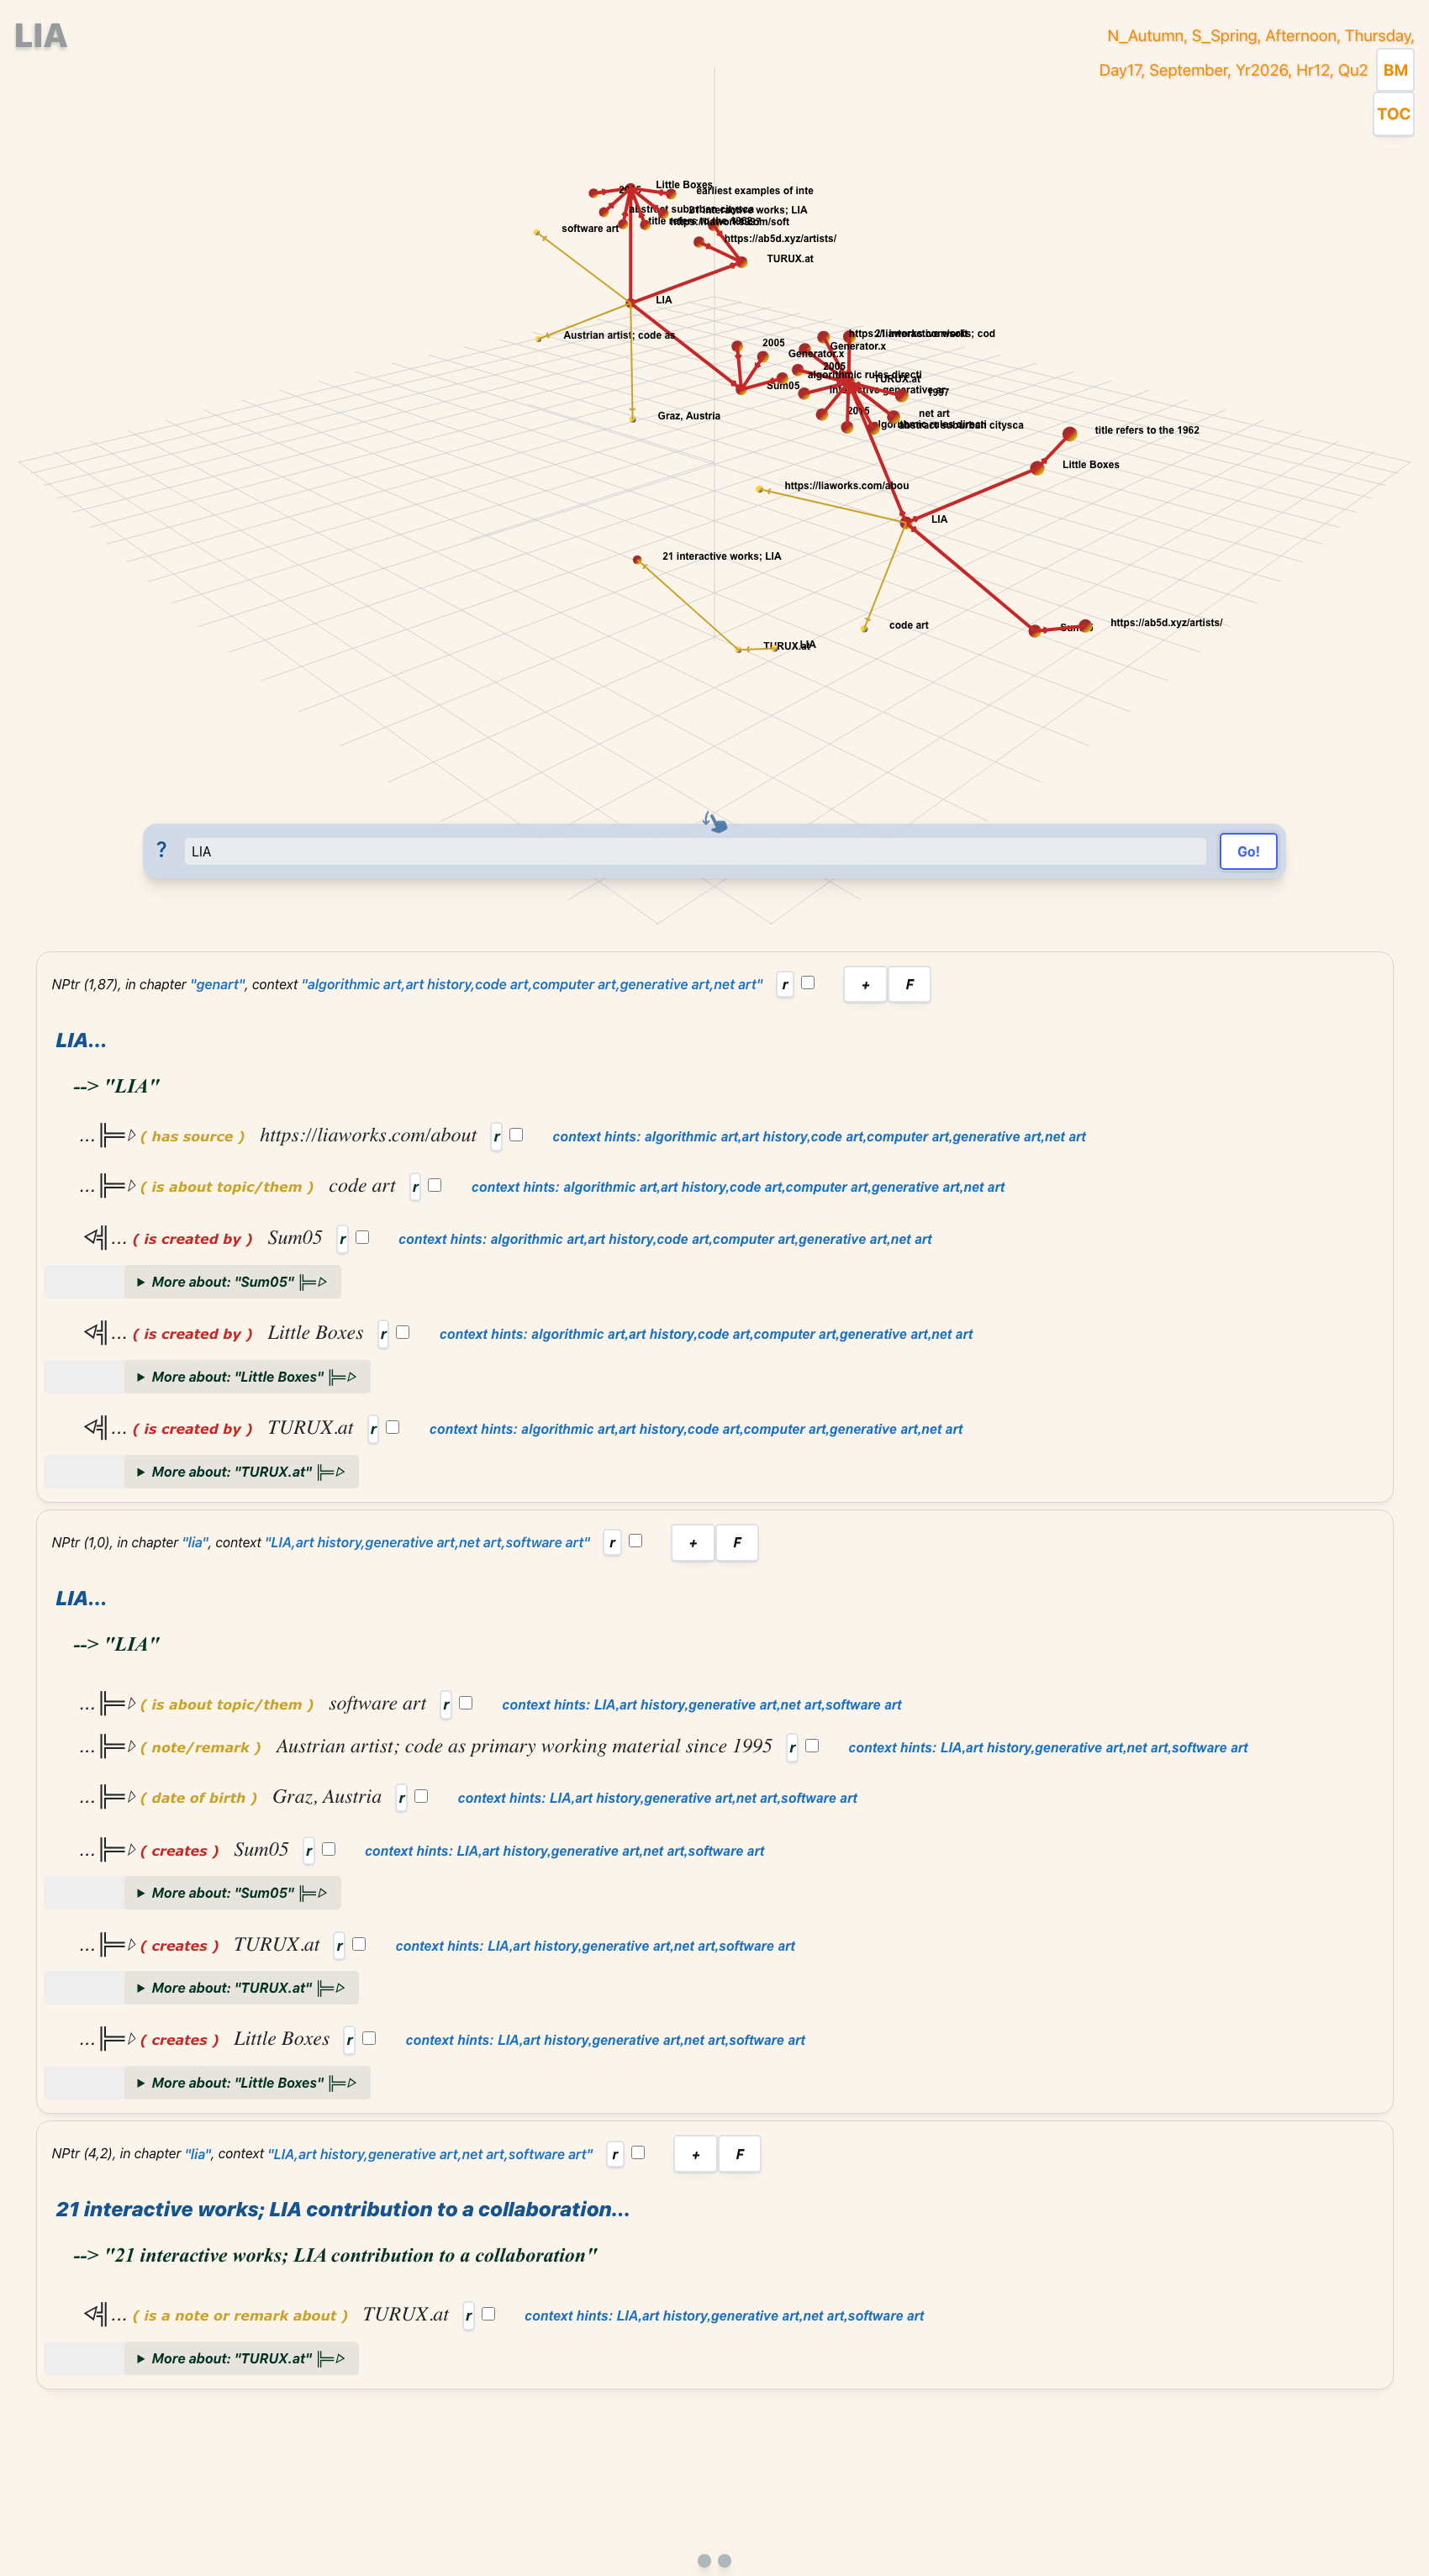
The screenshot below is the SSTorytime viewer, driven by a headless browser against the local instance, querying the LIA node. It is a capture of the real database, not a mock-up.
The live causal cone for LIA, read from Postgres through the SSTorytime http_server.